Tables in Assista X vs a Regular AI Chatbot
Most AI assistants return tables as plain markdown text — you can read them, but that's it. No exporting, no charting, no reshaping.
Assista X tables are interactive. Every table in the chat is backed by the actual structured data from your Odoo records. From any table you can export the data, instantly visualize it as a chart, or convert it into a pivot summary — all without asking a new question.
Expanding the Table
All table features are inside the expanded view. To access them:
- Hover over any table in the chat
- Click the expand icon that appears in the top-right corner of the table
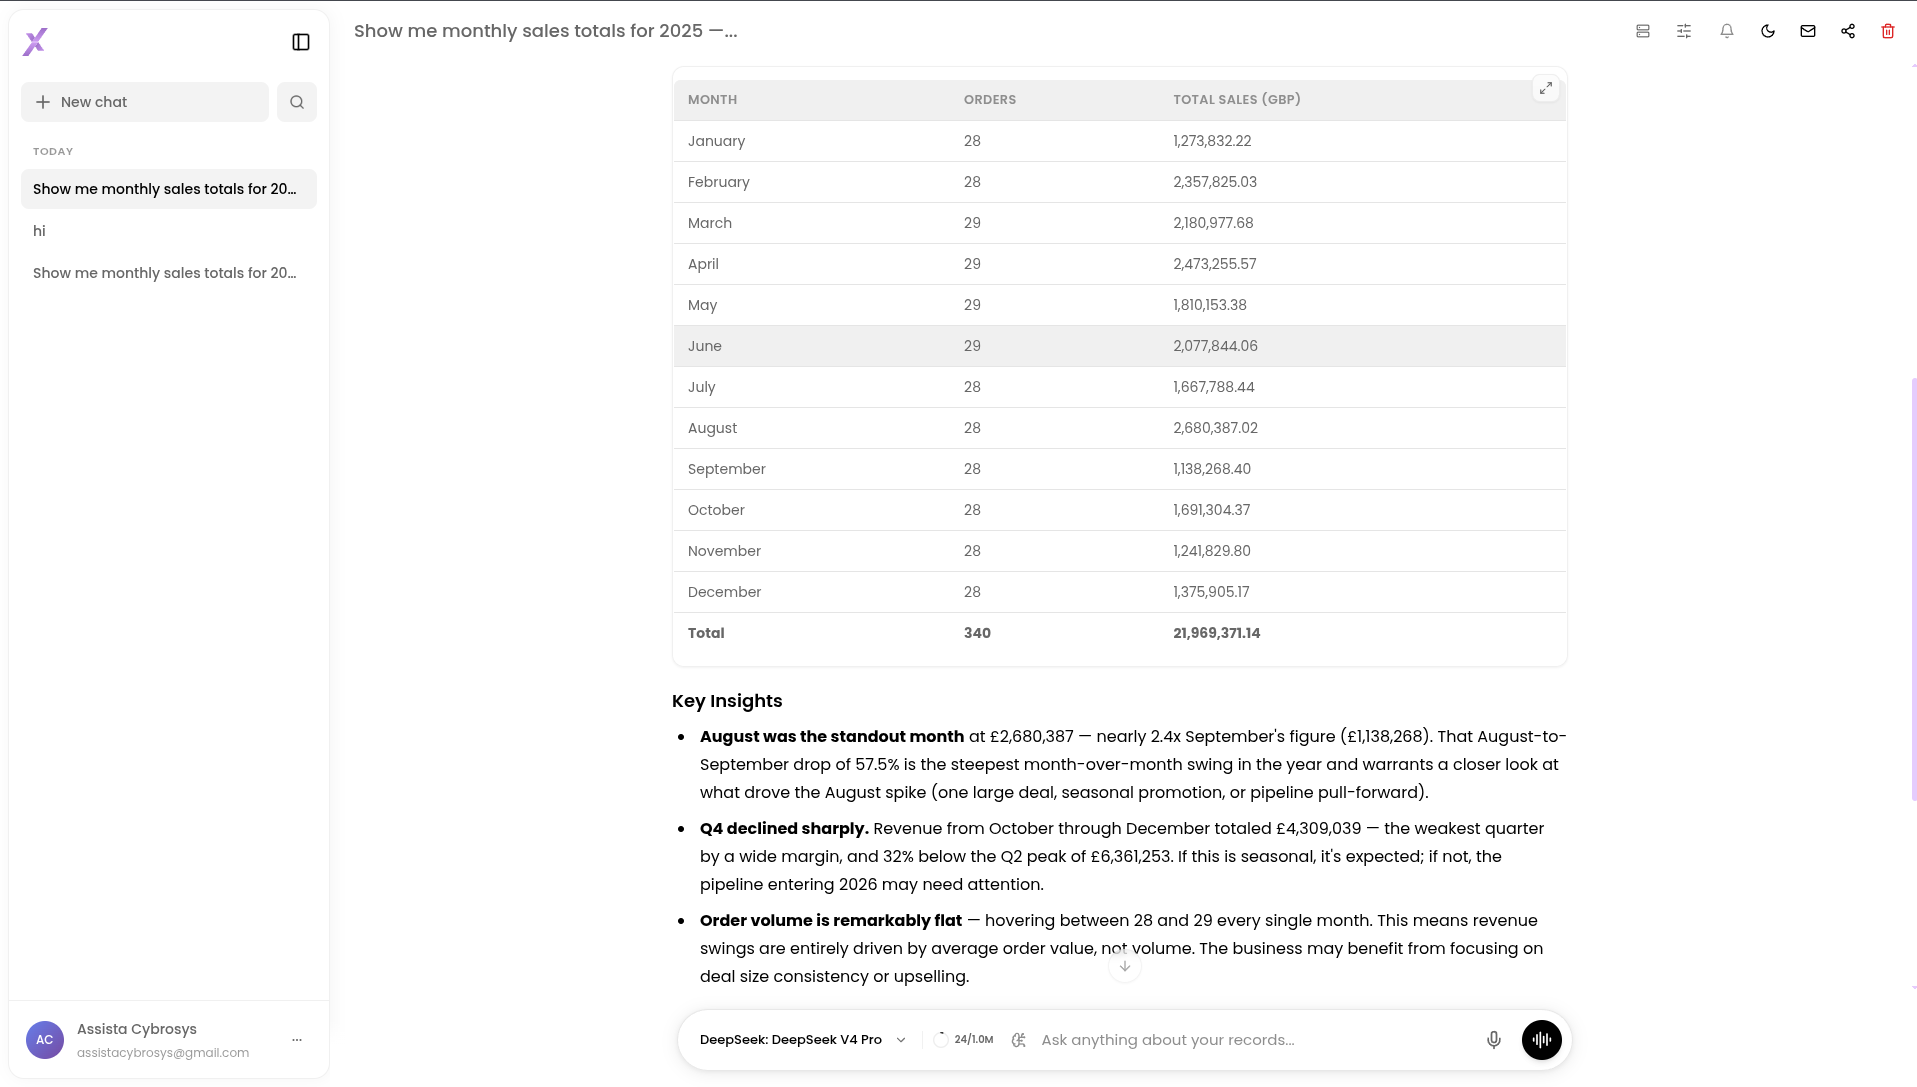
Hover to reveal the expand button, then click to open the full table view
Once expanded, you'll see the full table along with the control bar at the top.
Exporting the Table
In the expanded view, click Download Data to export the table data.
A small menu appears with two options:
| Format | Use Case |
|---|---|
| Export to CSV | Open in Excel, Google Sheets, or any data tool |
| Export to Excel | Download as a formatted .xlsx file |
The export captures every row and column from the table exactly as shown.
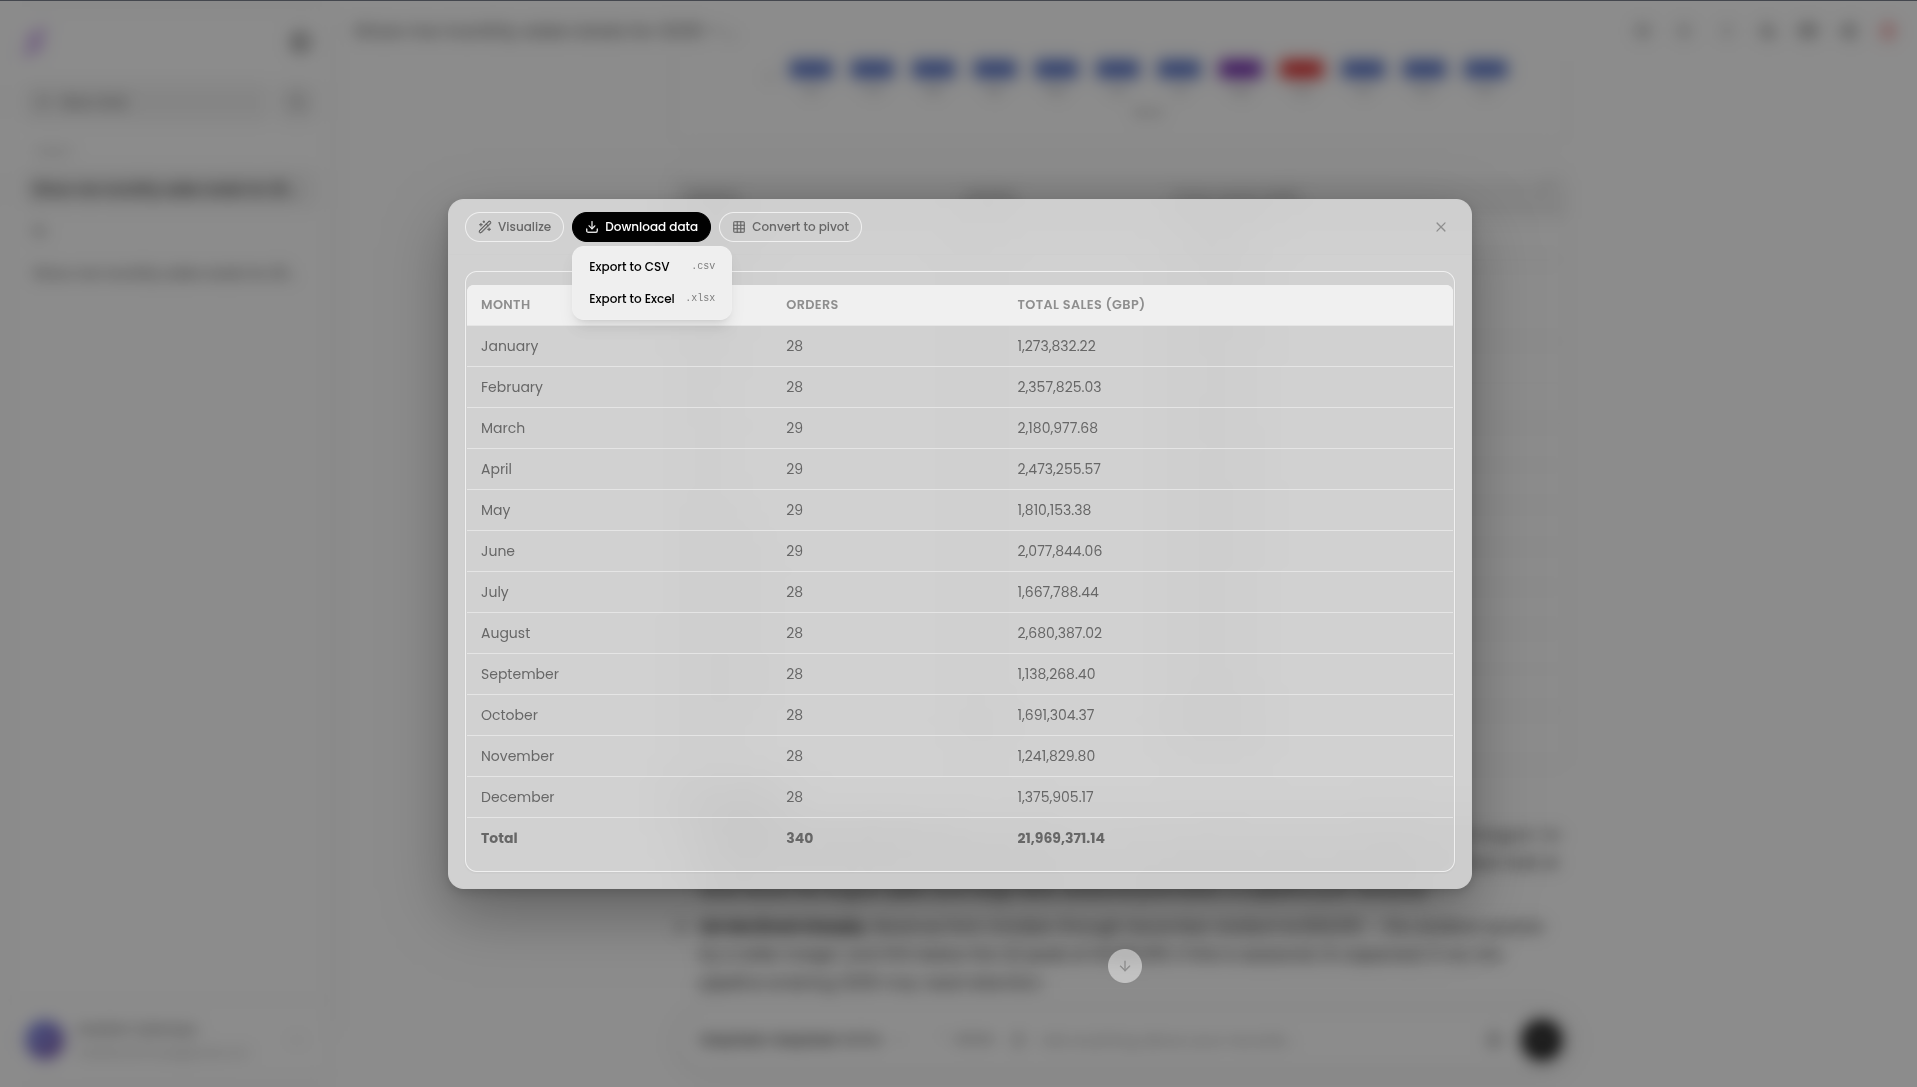
Click Download Data to export as CSV or Excel
Visualizing the Table as a Chart
If the table contains at least one numeric column, a Visualize button appears in the expanded view. Click it to instantly render the table data as an interactive chart.
Once the chart appears, you can:
- Switch chart type — choose from 11 types: Bar, Line, Area, Pie, Donut, Scatter, Radar, Heatmap, Funnel, Gauge, or Sankey
- Change the color palette — five palette swatches to repaint the chart instantly
- Download as PNG — save the chart as a high-resolution image
Click Hide Chart to return to the plain table view.
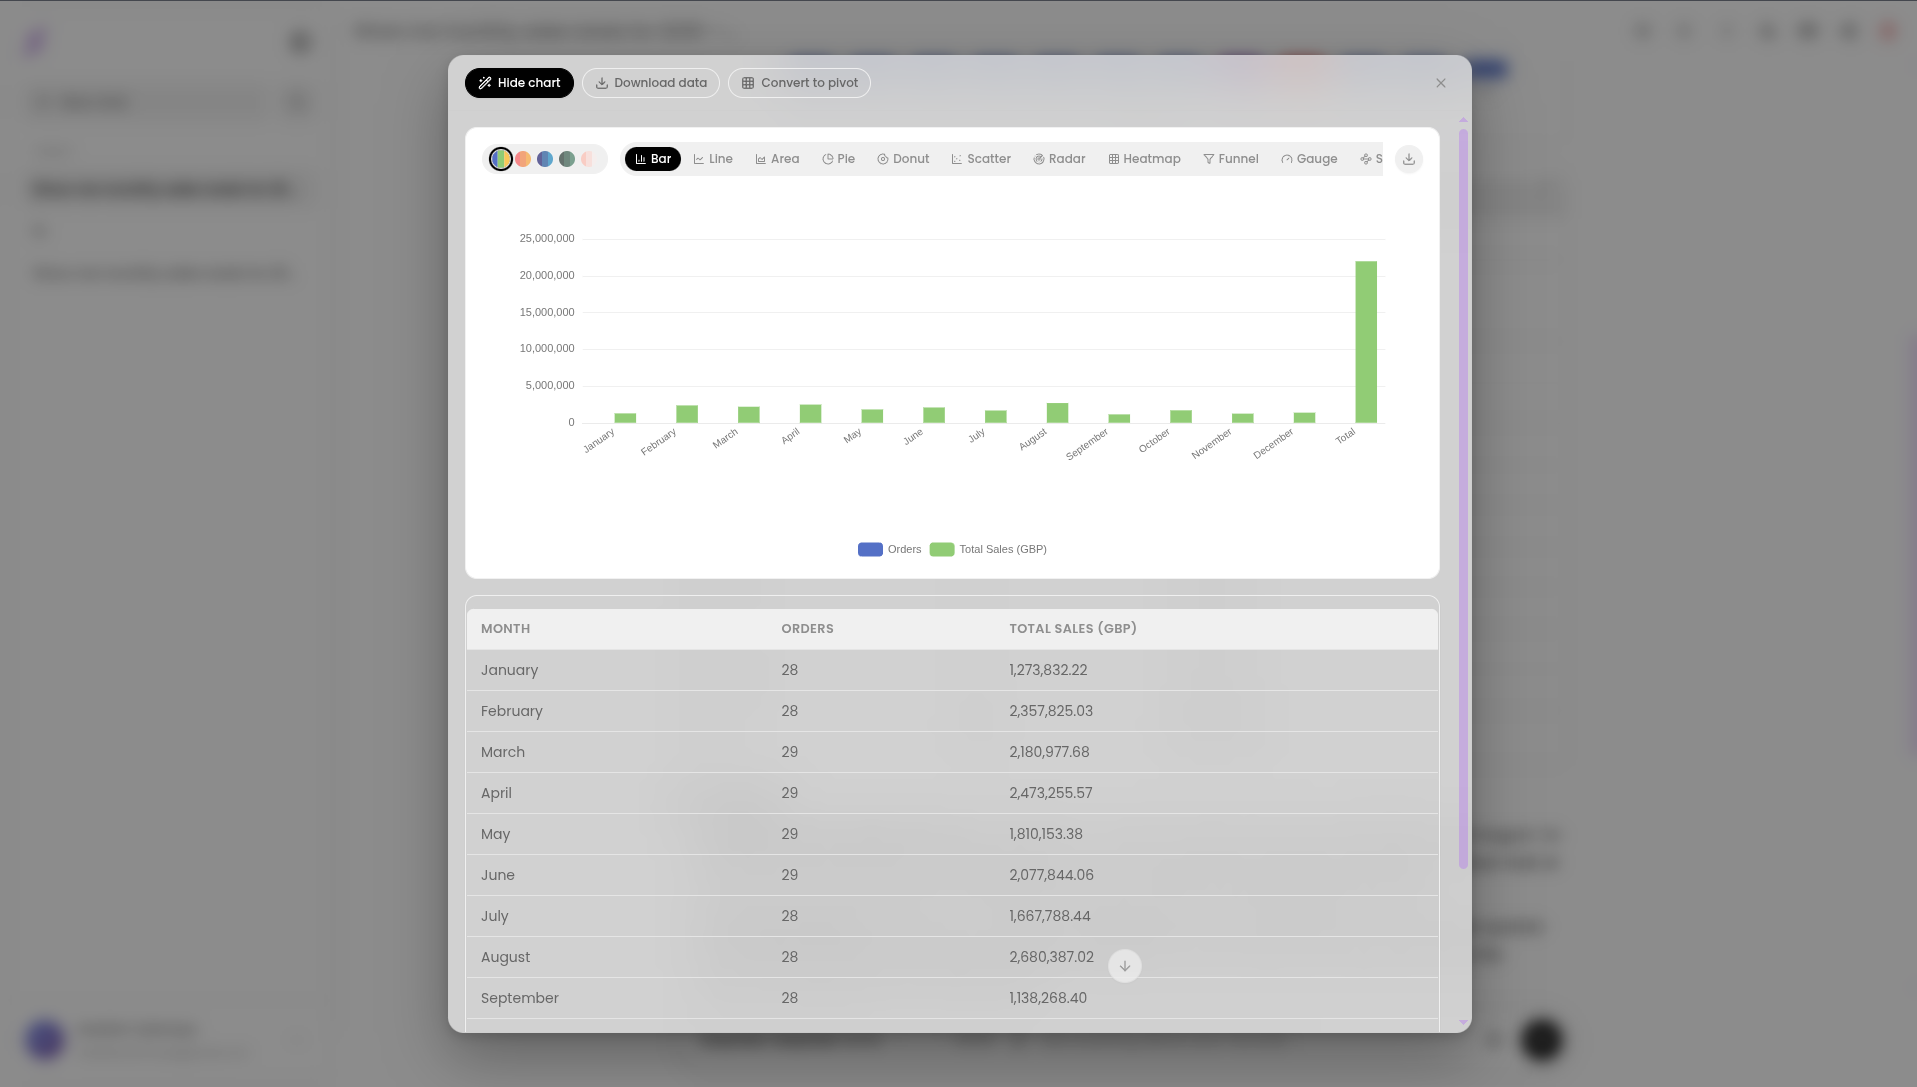
Visualize turns any numeric table into an interactive chart with 11 chart types
Pivot Table
The pivot feature lets you reshape the table data — group by any column, aggregate values, and see percentage share — all without writing a single formula.
How to Enable Pivot Table Hints
The pivot button only appears when the agent has suggested a pivot configuration for the table. To let the agent do this:
- Open any chat session
- Click the session settings icon in the navbar
- Turn on Pivot Table Hints
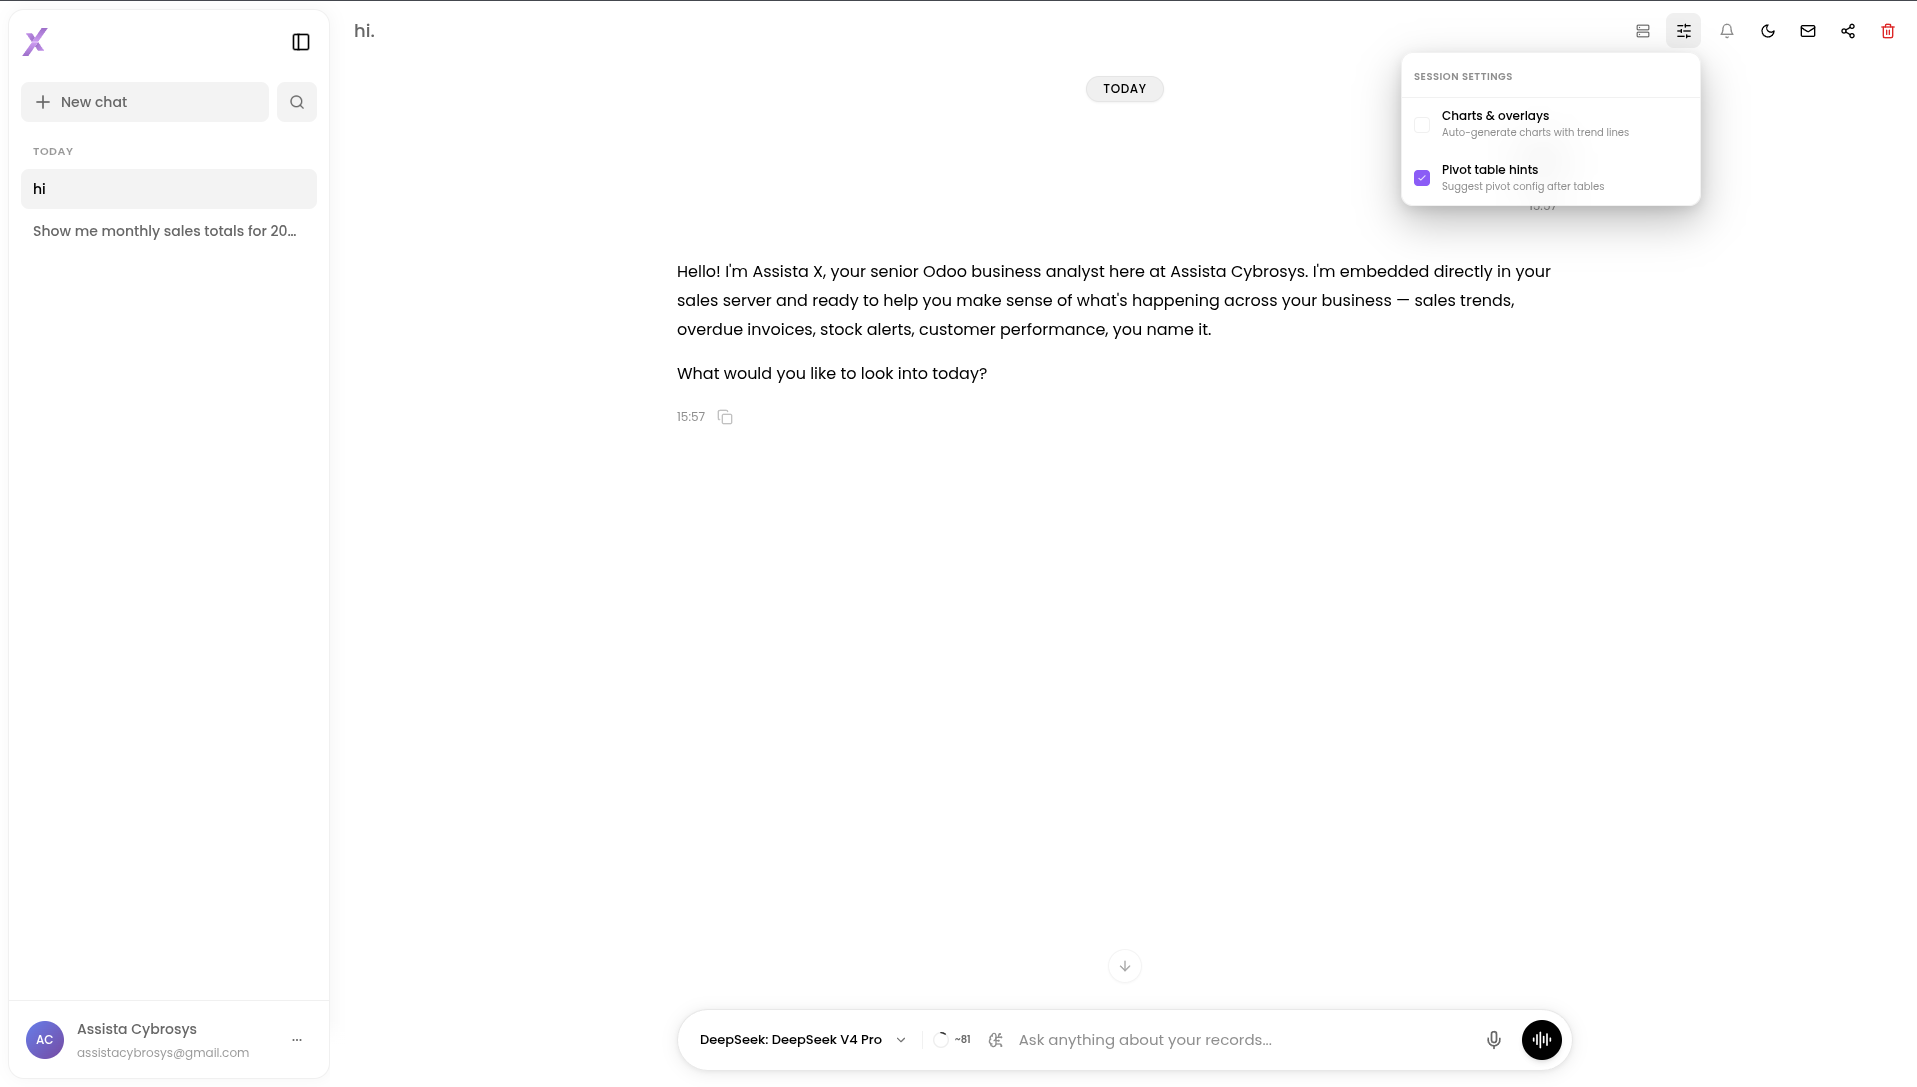
Enable Pivot Table Hints so the agent can suggest pivot configurations after tables
Once enabled, after any table with 3 or more columns, the agent will automatically suggest a pivot setup. The Convert to Pivot button then appears in the expanded table view.
Using the Pivot Table
Click Convert to Pivot to switch to pivot view. You'll see a control bar at the top with three settings:
| Control | What It Does |
|---|---|
| Rows | Choose which column to group by |
| Values | Choose which numeric column to aggregate |
| Aggregation | Sum, Average, Count, Min, or Max |
The pivot updates instantly as you change any setting. Each row shows the aggregated value and its percentage share of the total.
A Total row appears at the bottom when aggregation is set to Sum.
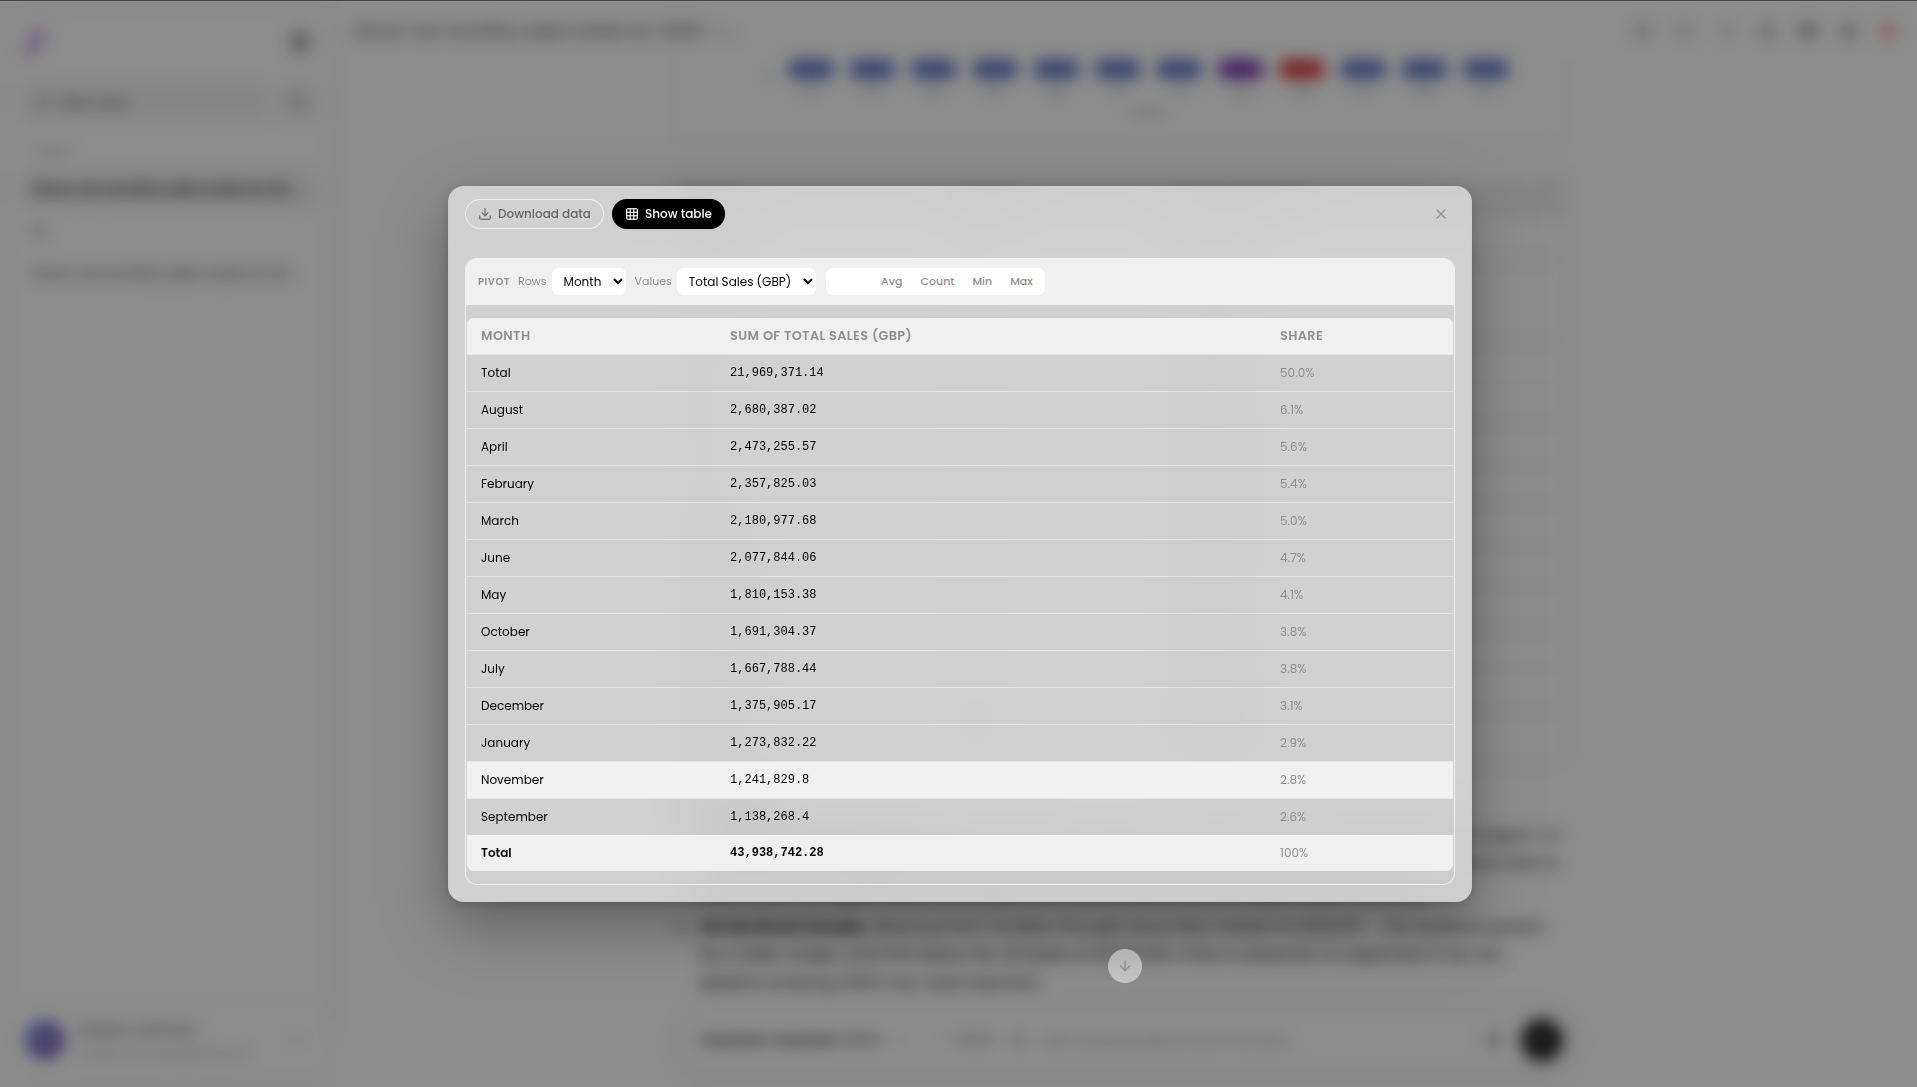
Group, aggregate, and see share percentages — all live with no extra queries
Click Show Table to return to the original table view.
Try It Yourself
These questions produce multi-column tables that unlock all the features above:
- "Show me all confirmed sale orders this month with customer, amount, and status"
- "List top 20 products by revenue this year with quantity sold and average price"
- "Show employee list with department, salary, and joining date"
- "Break down invoices by customer with total amount and number of invoices this quarter"